Charts / Readings
CAP CONTROL→Charts / Readings
One page for the graph and the table. The old separate “Readings” menu item is gone: everything lives here.
Help button — sensor, dates, search, chart, table and exports
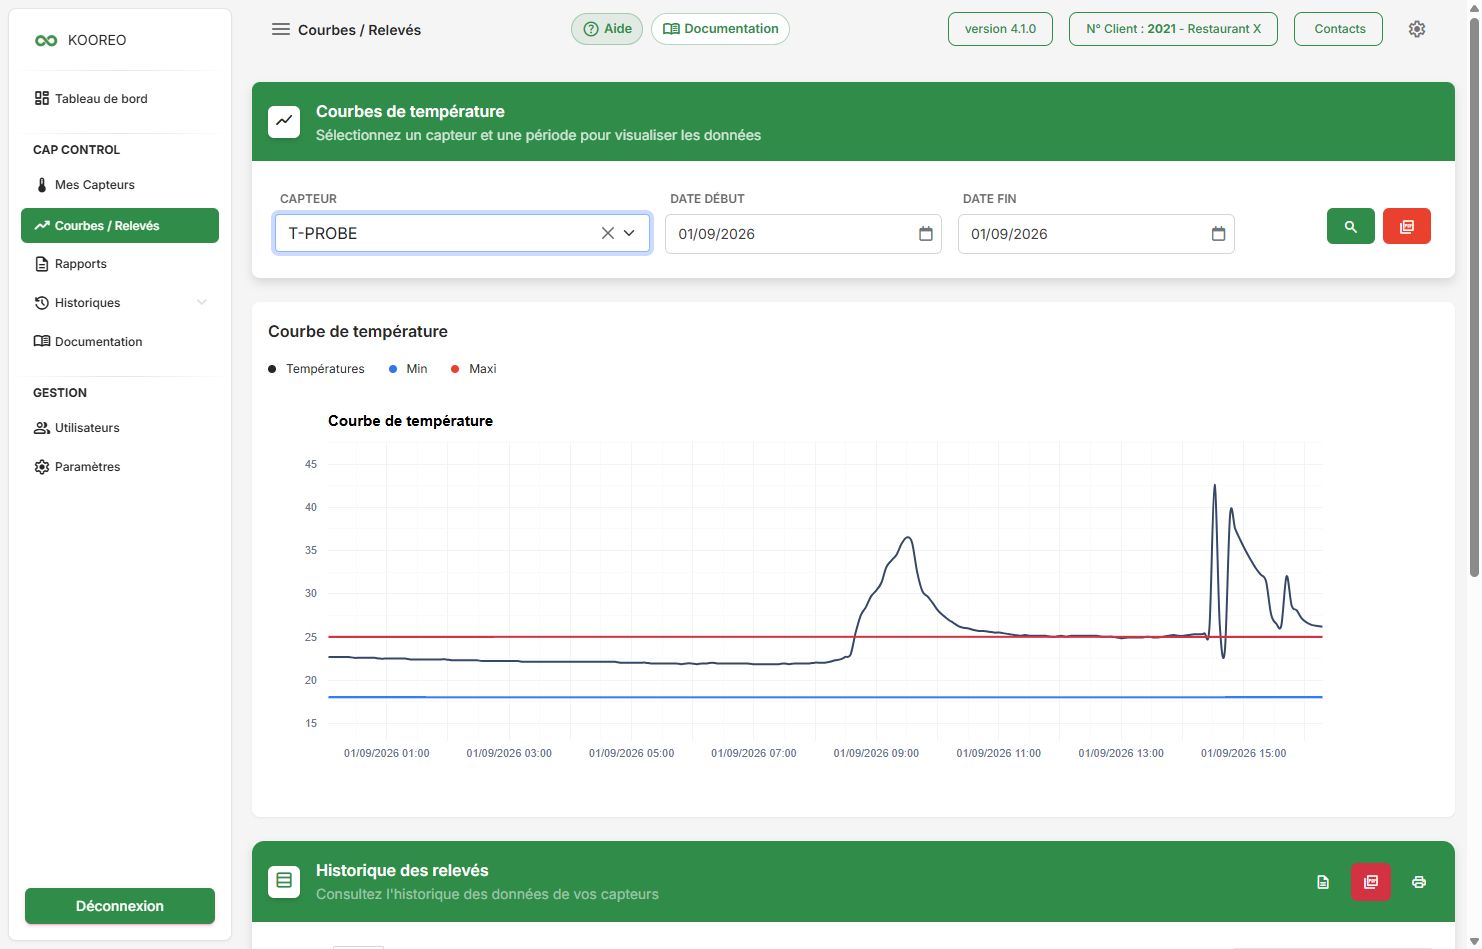
Show a period
- Choose the Sensor (drop-down).
- Set the start date and end date.
- Click the magnifying glass.
Until a search is run, a message asks you to select a sensor and a period.
The temperature chart appears with legends Temperatures, Min and Max (threshold lines). If prediction is in your plan, Prediction (possible trend) is added.
If the sensor measures humidity, a second chart appears beside it.
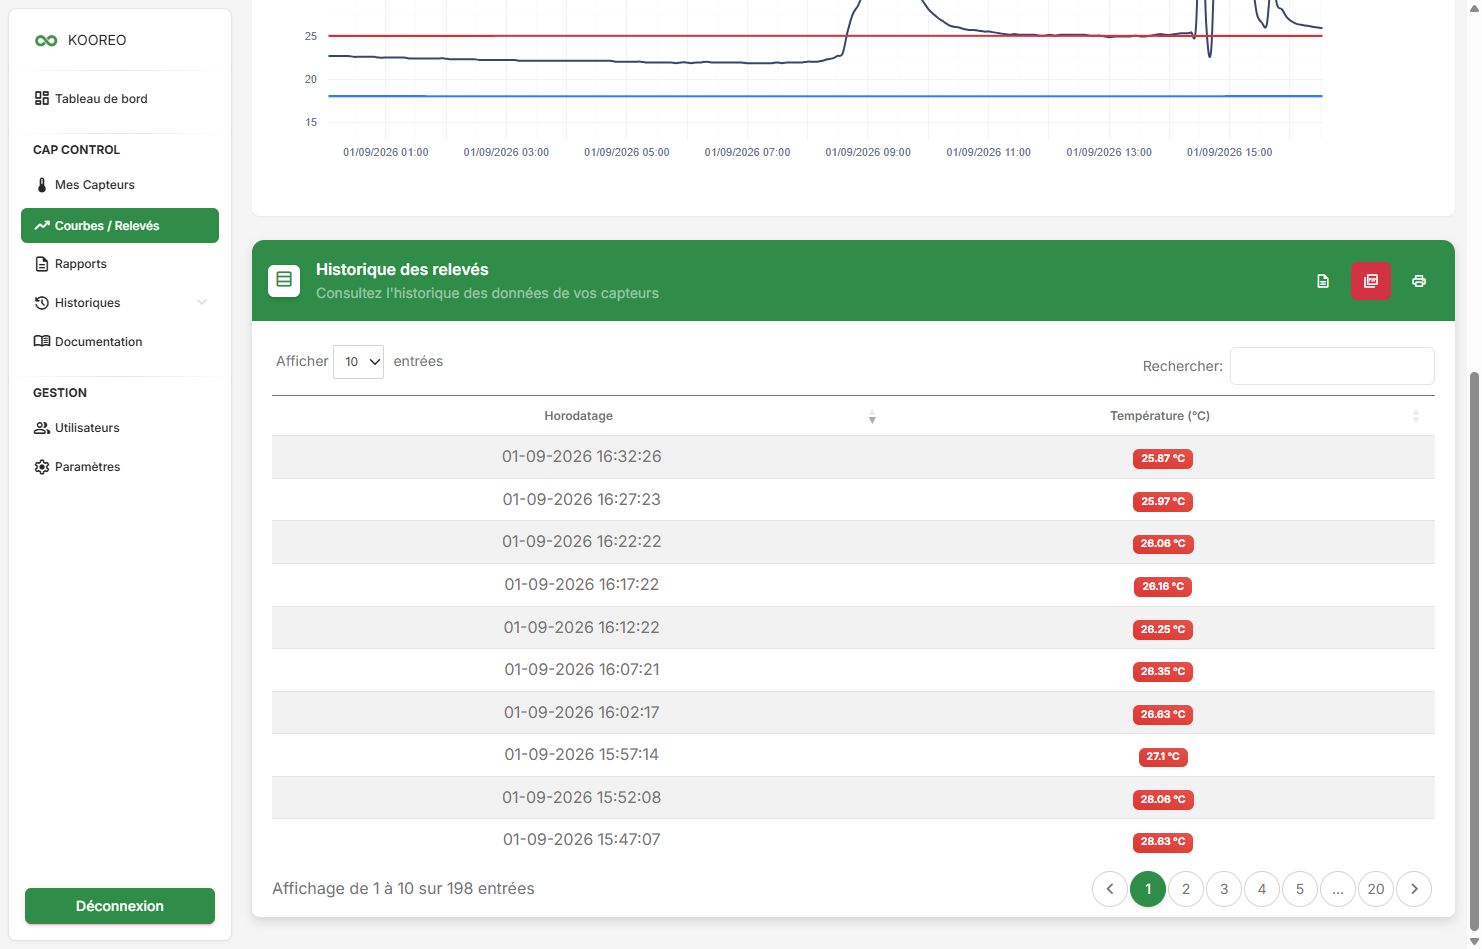
Readings table
Below the charts, the table lists Timestamp, Temperature (°C) and Humidity (%) when relevant. The table header is green, as in the app.
Exports
Export buttons appear only after a successful search.
| Export | Where |
|---|---|
| Chart PDF | Red button next to the magnifying glass. |
| Excel (CSV), PDF, Print | Top right of the Readings table. |